MaMA’s Demonstration Plots in the Catskills: What they tell us about the progression of EAB invasion
Since 2018, we have highlighted four of the MaMA Monitoring Plots Network plots in the Catskills as demonstration plots. Because all of these plots are in the network, the trees monitored in them had to satisfy its criteria that (when the plots were established in 2018) they comprise at least 40 native, naturally occurring mature (at least 4” diameter at breast height) ash that were not chemically treated against EAB. Considered together, the demonstration plots illustrate how EAB infestation and the resulting decline and death of ash have progressed over time and space across the Catskill region. However, each also has its own important story to tell, with lessons for how we can best respond in different areas of the region to facilitate long-term ash conservation and restoration.
The four plot locations are as follows, and they are shown on the Catskills MaMA action map by the abbreviations indicated below:
- Michael Kudish Natural History Preserve, Stamford (“MKNHP” on action map);
- Siuslaw Model Forest, Acra (“SMF” on action map);
- Catskills Visitor Center, Mt. Tremper (“CVC” on action map);
- DEC property, Lomontville (“DEC” on action map)
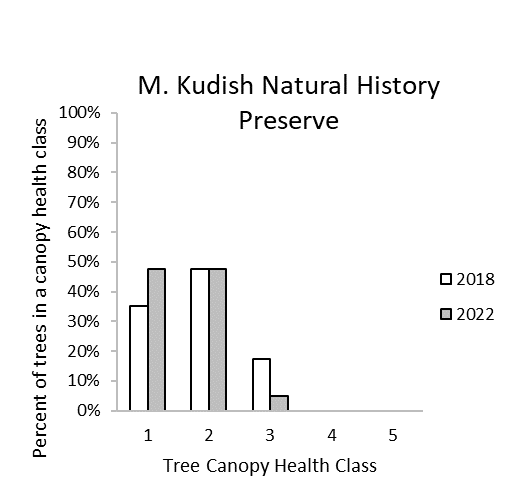
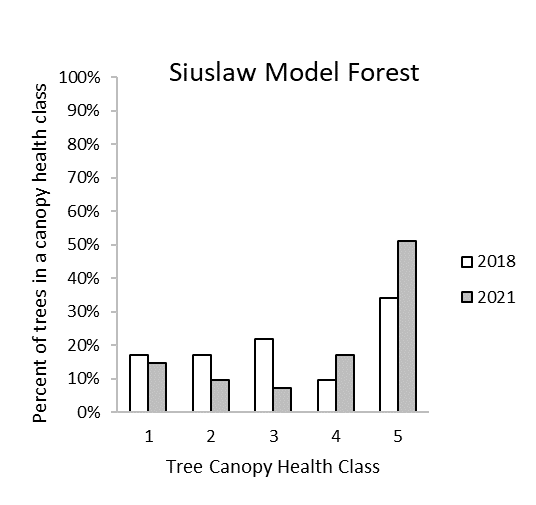
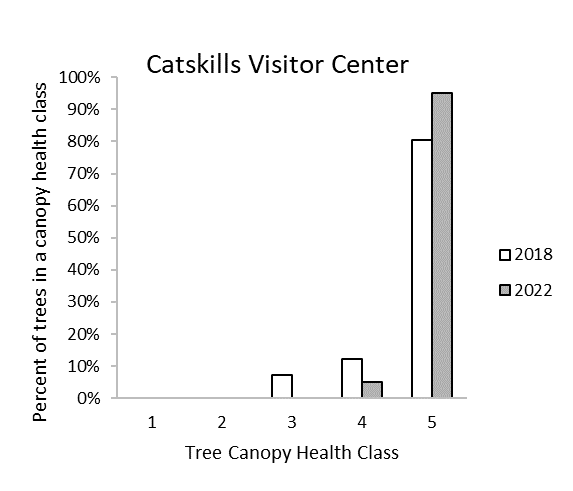
For each plot, we’ve included a graph that shows the crown health and mortality status of the ash trees monitored in it. You’ll see that each graph shows for both 2018 and 2022 the percentages of monitored ash in the plot that were in each of the following five crown health classes: Class 1 = completely healthy; class 2 = some twigs w/o leaves; class 3 = < 50% canopy die-back; class 4 = ≥ 50% canopy die-back; class 5 = dead due to EAB (you can see photos illustrating each of these five health classes here).
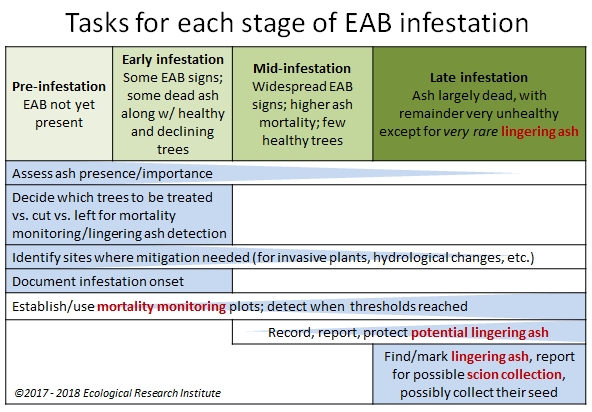
At the Michael Kudish Natural History Preserve, none of the trees in the plot have died from EAB, and moreover, the two most populous classes are 1 and 2, indicating that the trees are relatively healthy with only a small percentage in class 3. Additionally, although not shown in the graph, none of the trees there show definitive signs of EAB infestation. The situation at this preserve is representative of the many places in the Catskills where EAB has yet to show up (CRISP MaMA action map), let alone cause any mortality. Places such as this still have an opportunity to plan ahead for their management approach to EAB (Action task chart) and are also encouraged to remain vigilant so they can detect the almost-inevitable onset of EAB infestation.
The fact that some of the trees at this demonstration plot are in health class 3 and some in class 2 (i.e., not perfectly healthy) despite there being no definitive sign of EAB illustrates a very important point: even before the arrival of EAB in the region, many ash trees in the Catskills were already showed decline due to other causes. Now, it is often wrongly assumed both that EAB is present throughout the Catskills and that any unhealthy ash tree is attributable to this pest, and both misconceptions can result in mistaken approaches to ash management.
The plot at Siuslaw Model Forest is representative of areas that have already been invaded for years, but where the EAB-induced mortality is not yet high enough to trigger the search for lingering ash. In the case of Siuslaw, trees already killed by EAB were found during plot establishment in 2018 (34% mortality), with these trees most likely having been infested for at least a few years before succumbing. Nevertheless, as of 2021 (submission of 2022 data is pending), the EAB-induced cumulative mortality was 46%, meaning that it will likely be a few years until the 95% mortality is reached, beyond which an additional 2 years must pass before searching for lingering ash in the area.
The Catskills Visitor Center demonstration plot data are actually indicative of a trend that’s widespread in our monitoring plots more generally – that even once a high level of EAB-induced mortality has been attained, it often takes additional years to reach the 95% mortality threshold. In the case of the Catskills Visitor Center, even though we already found 80% mortality in 2018, 95% wasn’t reached until 2022, and therefore the search for lingering ash in that area generally will have to wait until 2024. In other words, even though it would have been easy to get the misimpression in 2018 that virtually all the ash at that site had already been killed by EAB, and it was time to search for lingering ash, the rigorous approach of plot monitoring revealed that this was not the case, and wouldn’t be the case for several more years.
Of all the demonstration plots, the only one in which showed 100% EAB-induced mortality of the monitored ash was the plot on DEC-managed land on Lapla Road (Lomontville). There, in fact, when collecting data while establishing the plot in 2018, we noted not only that all the trees had been killed by EAB, but also that the trees were already in an advanced state of decay, indicating that they had actually died years earlier. There were important lessons from this plot. First, the trees had clearly succumbed to EAB substantially sooner than would have been expected based solely on the first detection date noted for the vicinity of the plot in the state database (2013). This suggests that either the trees declined unusually quickly (due to environmental conditions of the site and/or inherent susceptibility of the trees) or because the initial detection of EAB was made when the infestation was unusually advanced. In either case, this shows that we cannot rely upon detection history alone in predicting when particular areas will be ready for lingering ash search – as again the monitoring plots supply crucial information. Second, this plot serves as an example of a “one-and-done” plot, i.e., one where the 95% mortality was documented on the first visit, and therefore no follow-up visits in subsequent years were needed.
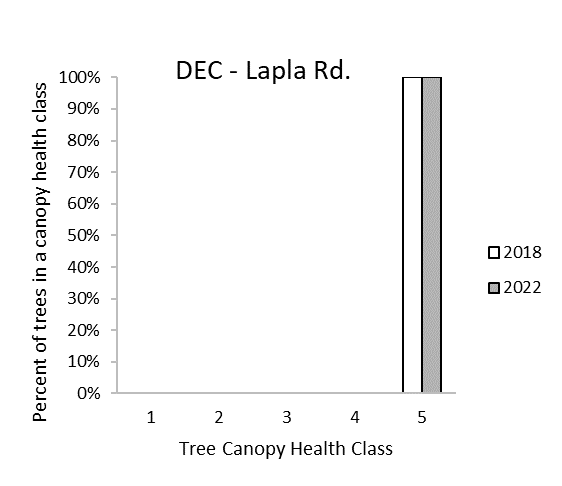
We strongly encourage establishing monitoring plots in high mortality areas, because the rigorous protocol enables distinguishing between cumulative mortality levels such as that at the Catskill Visitor Center in 2018 and that at Lapla Rd. in the same year – the former indicating an area not yet ready to be searched for lingering ash and the latter an area that already satisfied the criteria for such a search. Indeed, it’s crucial to document when areas reach the search threshold, because waiting too long to search an area for lingering trees can actually hinder finding actual lingering ash.
Questions? Email us at outreach@monitoringash.org